Insurance triangles are an indispensable tool in the insurance sector. They offer critical insights into claim patterns over time, which are key for reserve setting, pricing strategies, risk management, and regulatory compliance. In essence, they enable insurance companies to accurately gauge their liabilities and ensure that their reserves are set correctly.
Note: The data mentioned here is simulated (I will demonstrate how to generate simulated insurance data in an upcoming blog post).
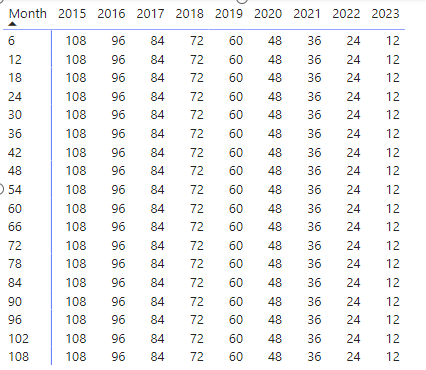
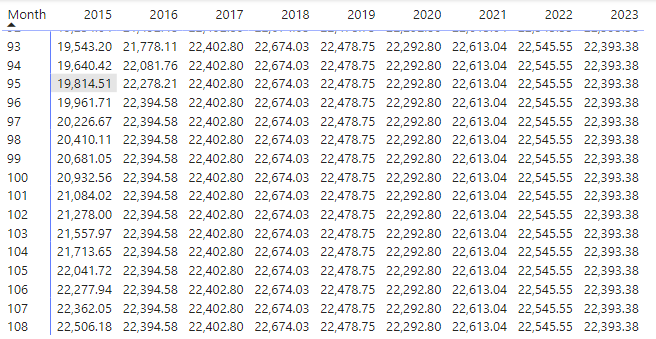
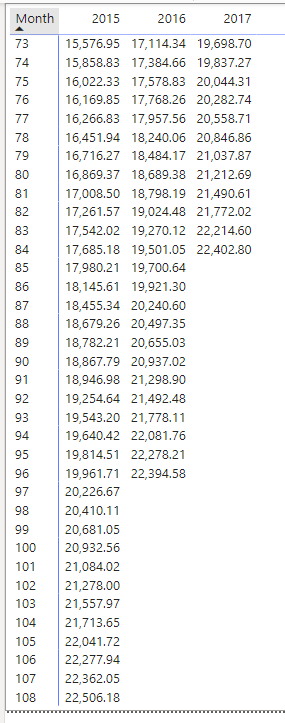
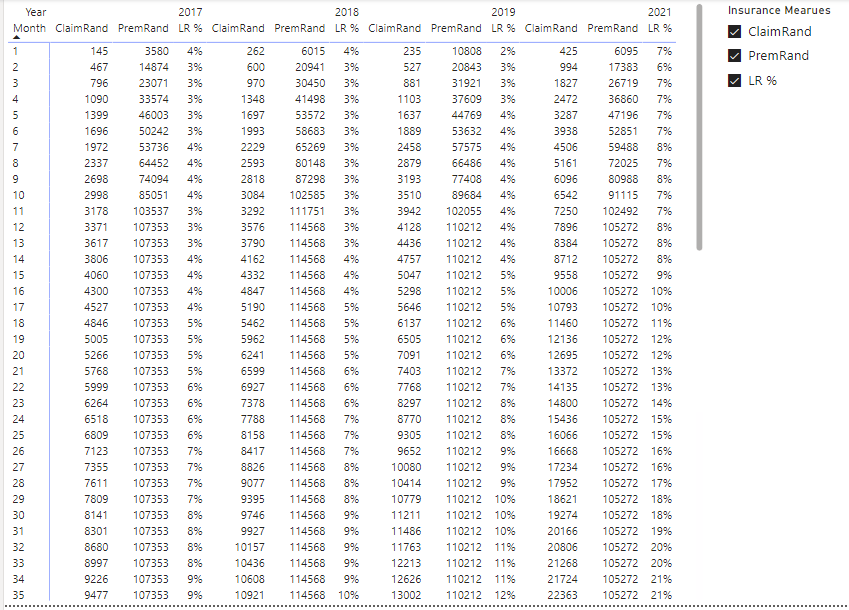
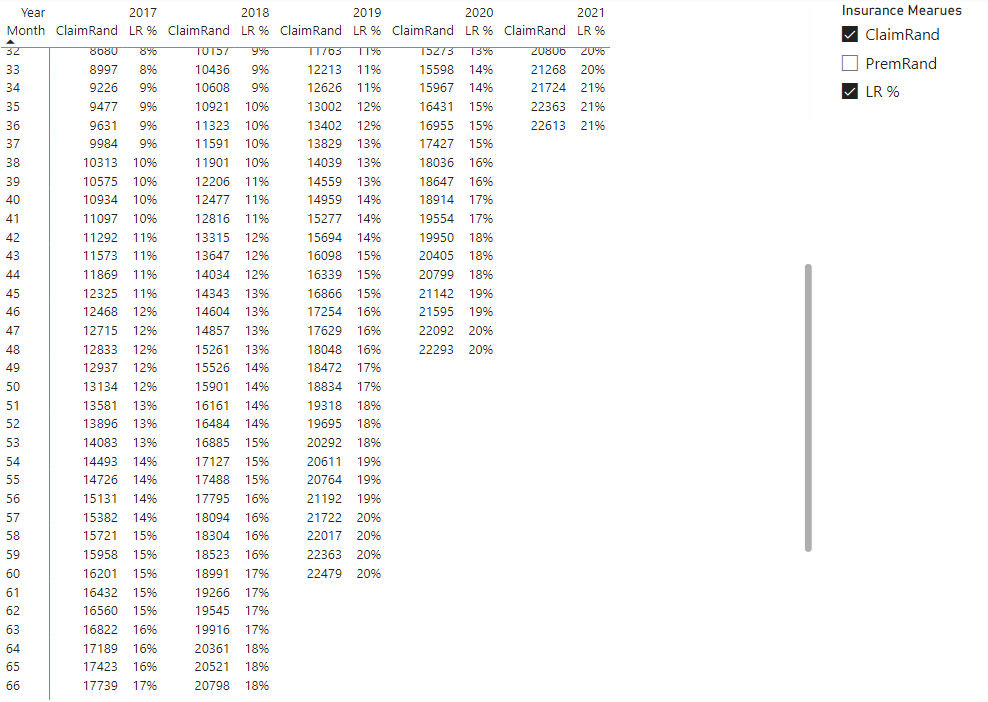
Here’s an example of an insurance triangle, structured with Years in columns and Development Months (in 6-month increments) up to the end of 2023.
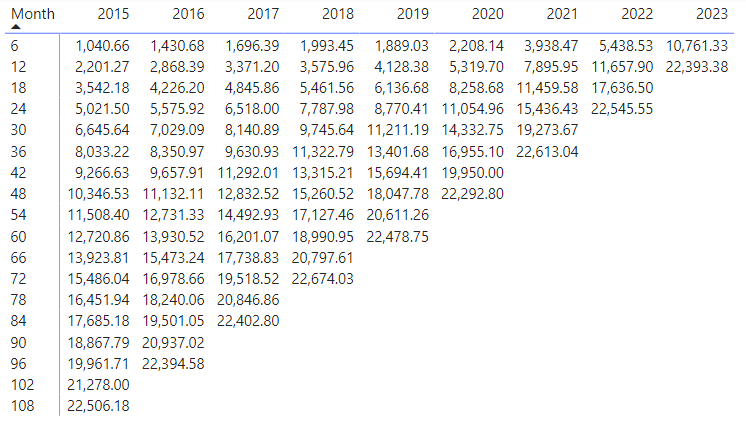
Typically, each cell in the triangle represents the aggregate claims up to that date, continuing through the end of 2023.
Now, let’s explore how to replicate these triangles in Power BI and tackle specific challenges:
- Generating monthly triangles efficiently without compromising performance
- Excluding months with no claims from the data
- Dynamically adding or removing metrics such as premiums and ratios
Firstly, we’ll look at the necessary data (I’ll explain how I created this data using Power Query in a future blog). Three data sets are needed:
Premium – Year and MonthInterval received
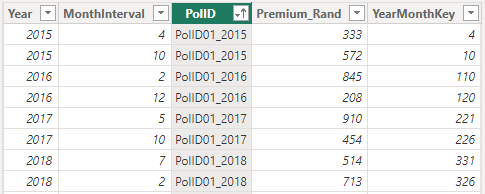
Claims – Year and MonthInterval paid.

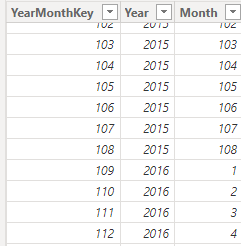
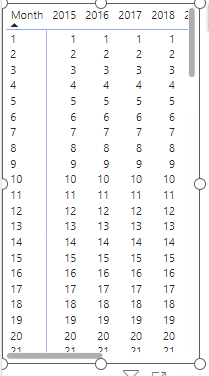
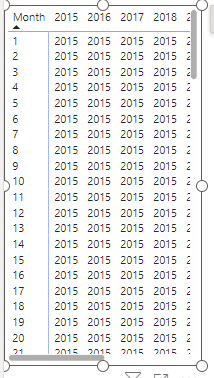
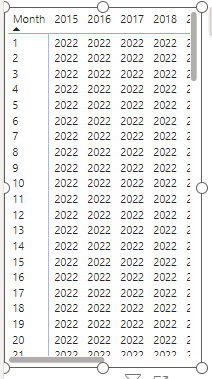
A combination of Years and Months (At least 108 MonthIntervals based on earliest year 2015)
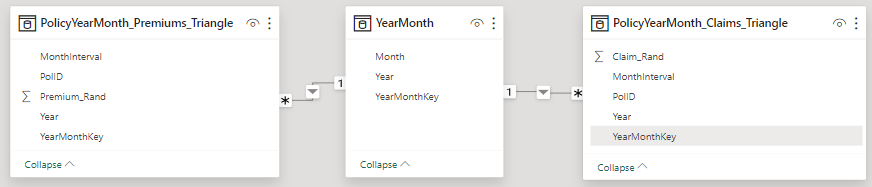
Then, we’ll construct the data model by linking the YearMonthKey to the transaction datasets in a 1 to Many relationship (1:*).
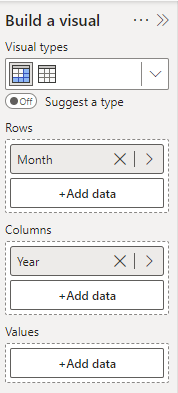
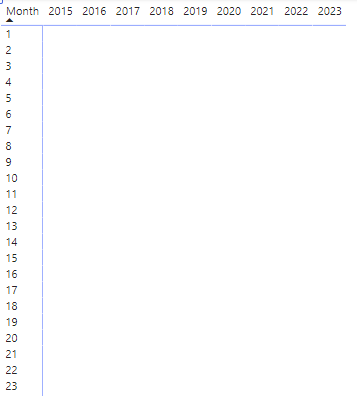
For visualizing the triangle, Power BI’s core Matrix visualization will be used. We add Months to the rows and Years to the columns from the YearMonth dataset, creating an empty matrix with all years and month intervals.
Next, we need to create a measure to calculate the cumulative amount at each Year and MonthInterval intersection.
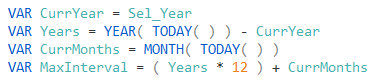
We start with the following four variables to ensure accurate values at each intersection.
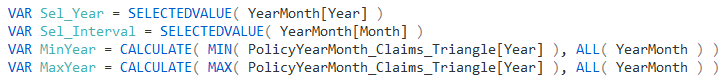
Add these Variables to find the maximum Interval for the column year:
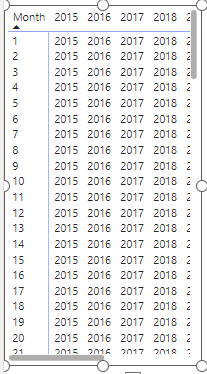
With these, we can determine the cumulative Claims Paid for each intersection in the matrix.
-1 Creating a virtual table using ADDCOLUMNS nested within a FILTER function to obtain the Year and relevant Month Intervals including the calculated claims.

-2 Then, employing the SUMX function to calculate the cumulative amount over the virtual table.

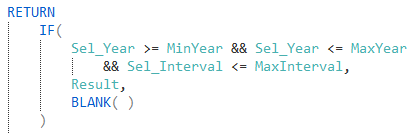
However, to ensure data cuts off at the correct Month Interval, we added logic to compare the matrix cell position against the initial variable values.
Finally, we add Premium and Loss Ratio measures to the data model. Then use Field Parameters to dynamically select Premium. Claim and Loss Ratio within a slicer.
In conclusion, this showcases an exciting and practical application of Power BI, and I’m considering a similar approach using PowerPivot. I welcome any thoughts or suggestions for improvement in the comments.

Sorry, I am struggling to understand the YearMonthKey. How was this constructed?
LikeLiked by 1 person
Hi Bernard, in the above example each year must have 108 rows. An extra row (month) is added as the time goes on.
Table is construccted manually upstream of Power Query, although you can also create in Power Query.
LikeLike